
A simple guide to track your Articulate Storyline Projects with Google Analytics, dynamically!
Understanding how learners interact with the resources we design is a crucial aspect of our roles as Learning Experience Designers and one of the first steps to understanding the impact the resources we develop have. However, traditional Learning Management System (LMS) analytics often provide limited insights. In some cases, accessing detailed learner usage data may require purchasing additional licenses for separate modules within the LMS. But there’s a smarter way to unlock comprehensive insights: Google Analytics. By integrating Google Analytics with our Articulate projects, we can track and measure virtually every aspect of learner engagement, without the constraints of traditional LMS analytics. Join me for a simple step-by-step guide on unleashing the power of learning analytics.
STEP 1
Sign into Google Analytics
Log-in or Sign-up to Google Analytics. If you already have a Google account associated with your company’s email address, such as yourname@yourcompany.com, sign in using those credentials. If you don’t have a Google account or if you’re creating a new account specifically for work-related analytics, we highly recommend using your company’s email address. This will make it much easier in the long run, especially if you need to invite colleagues to collaborate or if there’s a need to change administrative access in the future.
STEP 2
Set up the Account and Property
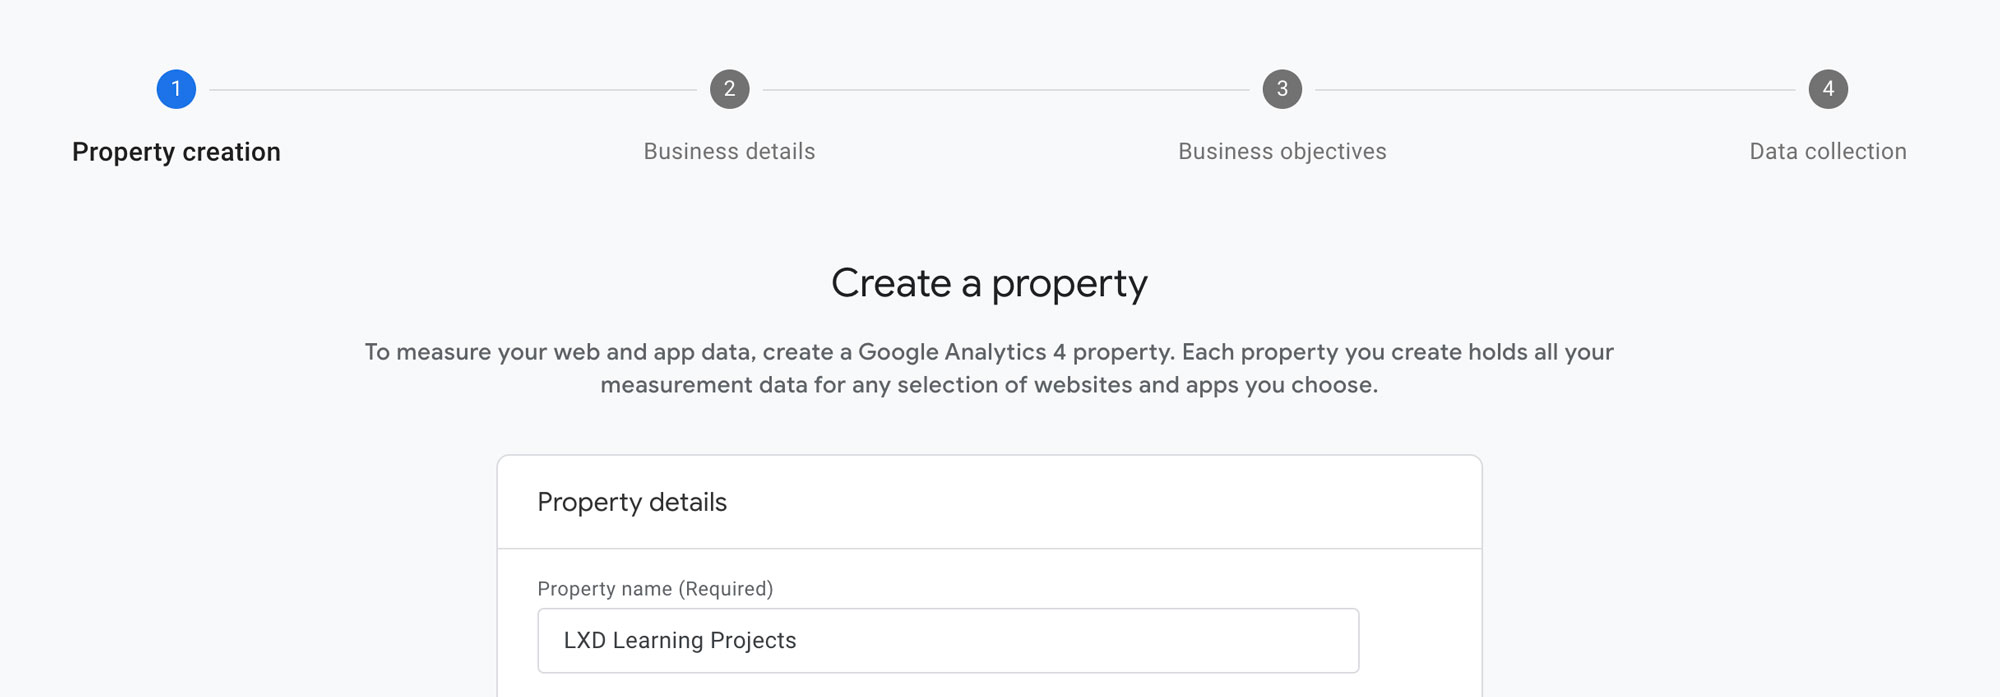
Click the Create button located at the top left of the dashboard, and click Account to create this first. Once you’ve created an account, the next step involves setting up a property within that account. These properties represent the specific digital assets you want to track, and each will have its own unique tracking ID. Click the Create button again and now select Property. As an example, in my LXD Account, I’ve created two properties: - LXD Learning Experience Design: To track visits to this LXD website. - LXD Learning Projects: To monitor engagement with my Articulate Storyline projects. To keep things organized, you could create one property for each URL where your content is hosted. This could be your portfolio, an LMS, a SharePoint site, etc. This approach helps you track and understand user activity on each platform separately.
STEP 3
Set up a Data Stream
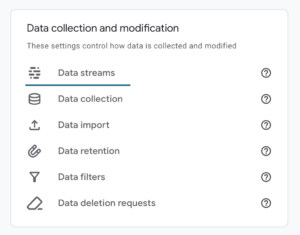
Setting up a Data Stream will provide you the tracking code needed to integrate Google Analytics with your Articulate files. Select the web data stream option and use the same Data Stream for all your Articulate files, regardless of their hosting or individual links. Click the Admin button (A cog icon button located at the bottom left of the dashboard) and from the “Data collection and modification” section, go to Data Streams. When setting up the Data Stream, you can use the final URL where people will interact with your files, like your portfolio or LMS URL. This ensures that all user interactions across your Articulate projects are tracked under one stream, simplifying data management and analysis. This seems confusing, but most likely, you will only need one Data Stream for your project, even if your Articulate exports are hosted in different links or buckets. Just use the URL your audience will be accessing from.
STEP 4
Get Your Measurement ID
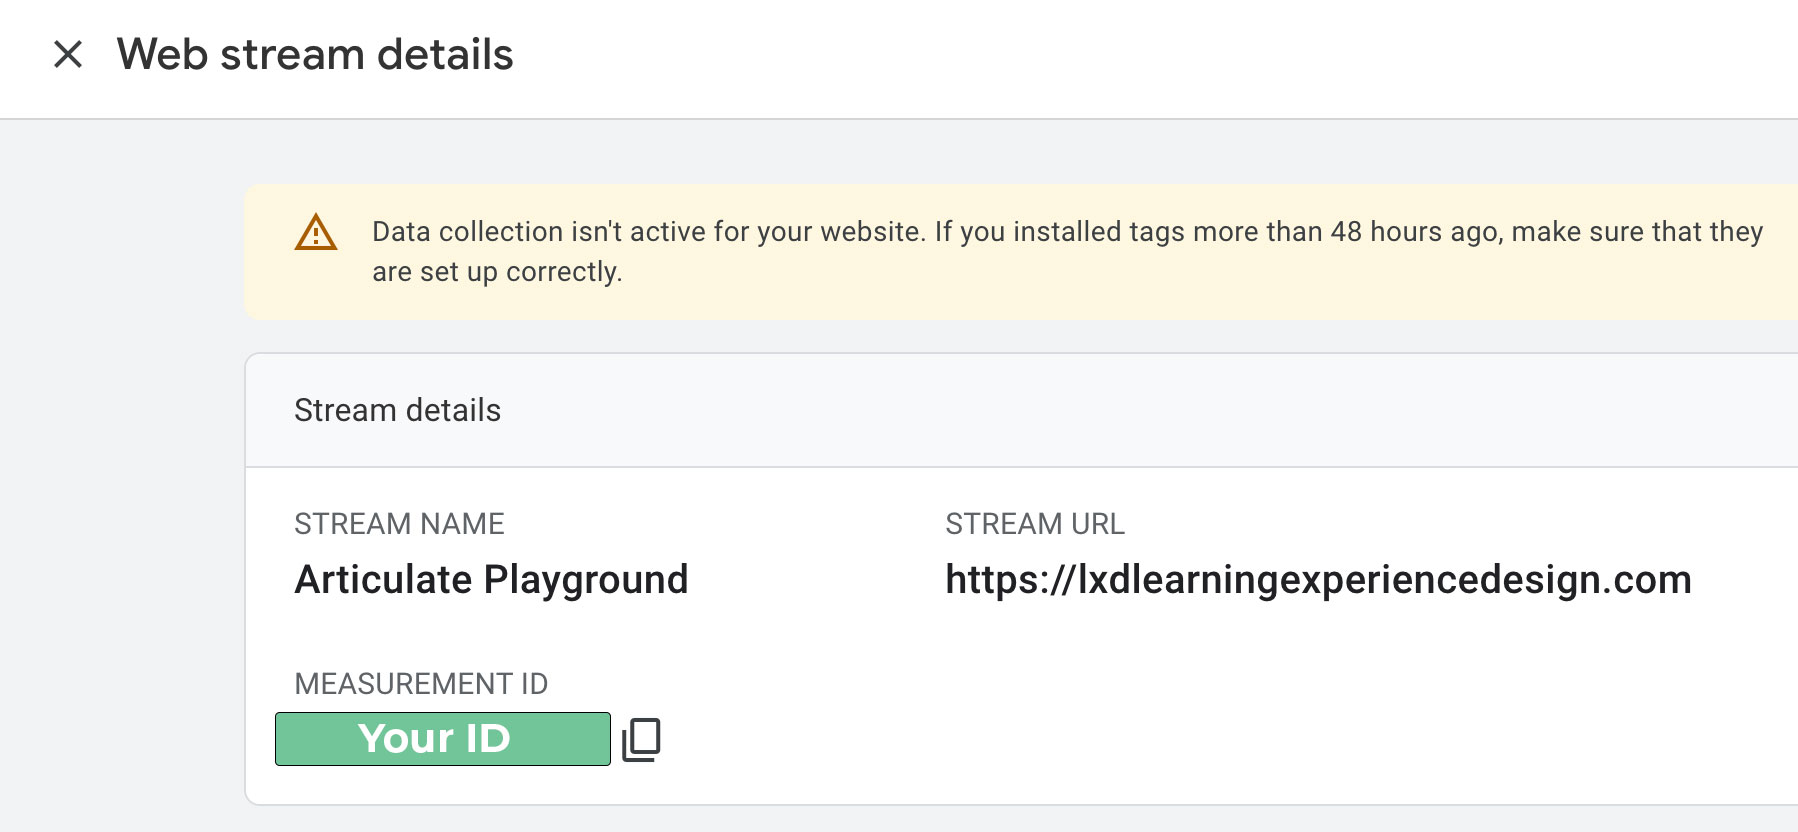
After setting up your Data Stream, you’ll obtain your Measurement or Google Analytics tracking ID. This ID is what you need to use to modify the code to begin sending data and events to your Google Analytics account!
STEP 5
Add your Google Analytics Tracking code to your Articulate Project
Now for the exciting part! Begin to track your Articulate Storyline Projects and see fresh data flow into your Google Analytics account. You’ll find two aspects of this code particularly impressive:
Key advantages of this approach:
- Dynamic tracking ID — Unlike many Google Analytics setups you might have encountered before, this method allows you to dynamically add your tracking ID to your Articulate Storyline project. This means there’s no need to manually insert your tracking code repeatedly with every project republish.
- Works inside iframes — This code even works when your published Articulate Storyline project is embedded elsewhere via an iframe. So, if you’re incorporating your Articulate interaction into your website, SharePoint site, etc., it’ll operate flawlessly! This flexibility opens up a wealth of possibilities, especially making it simpler to embed analytics on platforms where it has traditionally been difficult, like Microsoft SharePoint.
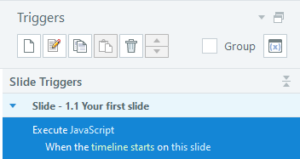
To add your Google Analytics tracking code, simply add a trigger that will execute a Javascript code, when the timeline starts on the first slide of your presentation. Click on JavaScript, and in the Javascript Editor, paste the following code replacing ‘YourMeasurementID’ with the ID generated in the previous step.
// Define your Google Tag Manager ID
const googleTagManagerID = 'YourMeasurementID';

// Create the first script tag for Google Tag Manager
var gtmScript = document.createElement('script');
gtmScript.id = 'google-ga-script';
gtmScript.async = true;
gtmScript.src = 'https://www.googletagmanager.com/gtag/js?id=' + googleTagManagerID;

// Append the first script tag to the head
document.head.appendChild(gtmScript);

// Create the inline script
var inlineScript = document.createElement('script');
inlineScript.id = 'google-ga-datalayer-script';
inlineScript.text = `
window.dataLayer = window.dataLayer || [];
function gtag(){dataLayer.push(arguments);}
gtag('js', new Date());
gtag('config', '` + googleTagManagerID + `', {
  'cookie_flags': 'SameSite=None;Secure'
});
gtag('set', 'cookie_flags', 'SameSite=None;Secure');
`;

// Append the inline script to the head
document.head.appendChild(inlineScript);
STEP 6
Publish and test
The final step will be simply to Publish your project as Web and upload it to your server, bucket or site. Make sure you are happy with your file’s title as this is the title that will appear in your Google Analytics Account (it’s going to be like a page for you). You can directly access your story.html or embed it on any page. Go back to your Google Analytics Account to test everything is working fine. Click somewhere on your Articulate Storyline slide to ensure it is on focus, change your Google Analytics view to Real-time and you should be able to see your exact location from there!
STEP 7
Bonus - Create and track custom events!
If you followed the previous steps you should now be able to track your Articulate Storyline Projects with Google Analytics. But it doesn’t end there. Now you are all set to start measuring and tracking anything that you want from your projects. How? With custom events! To do so, simply add additional triggers that will execute your custom events. You can add these to be triggered however you want: with user clicks, mouse hovers, when you reach a time in your timeline, when a state changes, etc. This gives you limitless possibilities to understand your users or get data or responses from them. You can learn more about Google Events here. But here is the basic format you can use in your Javascript trigger:
gtag('event', 'name', {
  'event_category': 'category',
  'event_label': 'label',
  'value': 1
});
For example, if you are creating an interactive selector for your SAP systems’ training, and you want to track the level of usage or interest of the different topics, your Javascript event could look like this:
gtag('event', 'Navigation Basics', {
  'event_category': 'SAP training interest',
  'event_label': 'Navigation Basics'
});
In this case you would keep the same event_category name for all the topics, so you know these are all part of the same group. And in your Google Analytics Report Snapshot, under your “What are your top events?” widget, you will see all your custom events, in this case your different topics, like the just added Navigation Basics, listed with the pertinent event count.
Key Questions Answered
The most commonly asked questions about this topic, concisely answered.
- LMS analytics are often limited to basic completion and quiz scores, and accessing detailed data may require expensive add-on modules. Google Analytics lets you track slide visits, time on task, custom events, and learner behavior patterns — free of charge and without LMS restrictions.
- Yes. The JavaScript implementation described in this guide works inside iframes — so it functions correctly whether your Articulate file is hosted directly, embedded in a SharePoint site, an LMS, or a portfolio page.
- No. The dynamic tracking approach stores the Measurement ID in a variable, so you can update the ID without republishing your Storyline project. This saves significant time when managing multiple projects or switching Analytics accounts.
- A Measurement ID (format: G-XXXXXXXXXX) is the unique identifier for a GA4 Data Stream. You find it in your Google Analytics account under Admin > Data Streams. Select your web stream and the Measurement ID appears at the top right of the stream details panel.
- You can use one Data Stream for all your Articulate projects, even if they are hosted at different URLs. Use the primary URL your audience accesses (portfolio, LMS, etc.) when creating the stream. Each Storyline file will appear as a separate page title within the same property.
- A custom event records a specific learner action (button click, topic selection, timeline milestone). Add a trigger in Articulate Storyline set to 'Execute JavaScript' on the desired user interaction, then paste the gtag event code with your chosen event name, category, and label.
- With the basic setup you can see active users in real time, session counts, page views per slide file, and geographic location. With custom events you can also track which topics learners clicked, how far they progressed, and where engagement drops off.
- Corporate firewalls or network policies may block Google Analytics script requests for some learners. To maximize coverage, test the integration on your target network before rollout. If GA is blocked internally, consider server-side tagging or alternative analytics tools approved by your IT team.
- Google Analytics collects IP-based data by default, which has privacy implications under GDPR and similar regulations. Enable IP anonymization, configure data retention settings, and review your organization's data processing agreements with Google. Always inform learners about analytics tracking in your course or platform privacy notice.
- Use the 'Execute JavaScript' action triggered when the timeline starts on Slide 1. This ensures the GA script loads as soon as the learner begins the course. For custom events, add additional triggers on the relevant slide or object using the interaction that matches the behavior you want to track.
- The described method is specific to Articulate Storyline because it relies on adding JavaScript triggers inside the authoring tool. Articulate Rise does not support custom JavaScript injection in the same way. For Rise, you would need to inject tracking code at the hosting page level rather than inside the exported course package.
- LMS analytics typically show basic completion and score data. Google Analytics adds behavioral insights — which slides learners spend the most time on, where they drop off, which paths they take in branching scenarios, and how they navigate through content. This data is invaluable for iterating on course design, identifying confusing content, and making evidence-based improvements.
- Yes. Google Analytics 4 (GA4) uses an event-based model rather than the session-based model of Universal Analytics. This means you send custom events (like slide views and quiz completions) using the gtag.js measurement code rather than the older analytics.js library. The Storyline JavaScript trigger approach remains the same — you just need to update the tracking code syntax to match GA4's event structure.